Keyframe Graph
The graph appears on the right side of the Keyframe Editor and displays the curves of
selected parameters. The graph has a time ruler at the top and a zoom/scroll control at
the bottom and side that are identical to the corresponding controls in the Timeline. The
time ruler shows where keyframes, project markers, playback In and Out points, and the
playhead are. Using the zoom controls at the bottom of the graph, you can focus on
regions of the sequence to edit. For more information on using the zoom/scroll controls,
see
Zooming in the Timeline
.
598
Chapter 12
Keyframes and Curves
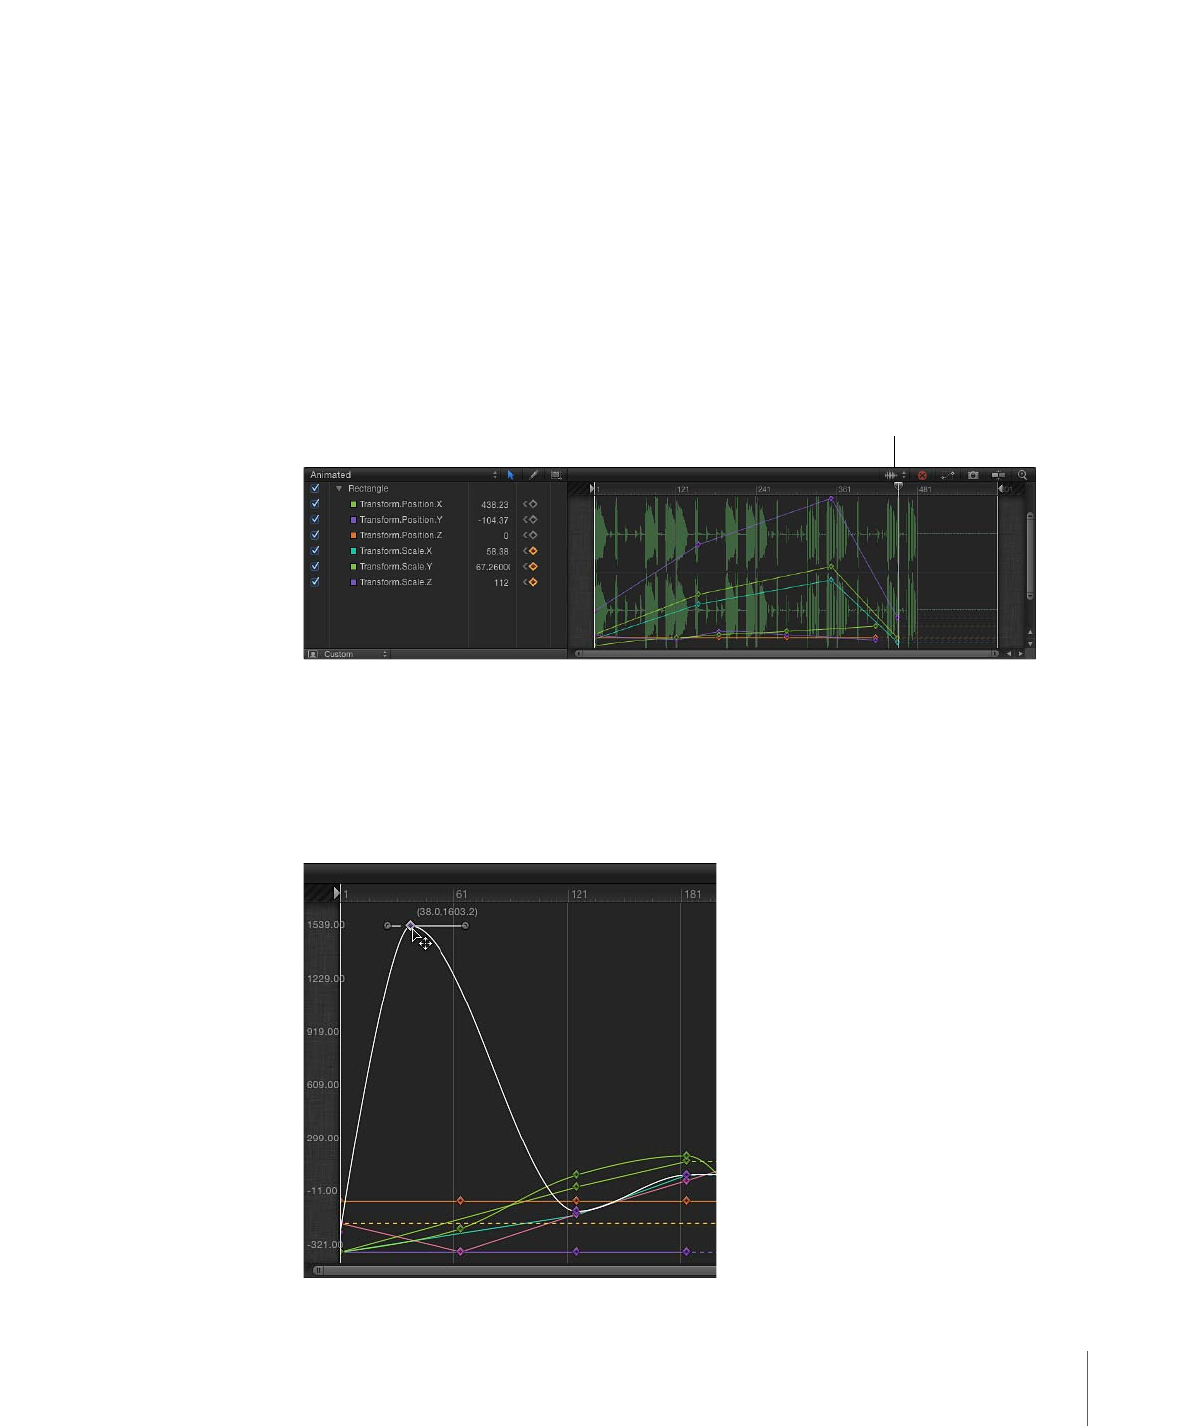
The body of the graph displays the keyframes and curves of active parameters (those in
the parameters list). Each curve is a different color, although some colors are duplicated.